
The Scarcity Compass
Sound Money Math


In a world where central bankers can create trillions of dollars with a few keystrokes, one metric still signals true scarcity: the stock-to-flow ratio. This simple calculation – how many years of current production equals existing supply – holds the key to understanding why some assets preserve wealth across generations while others crumble under the weight of inflation.
Stock-to-Flow: The Scarcity Compass
Stock-to-flow is a scarcity metric that expresses how many years of current production (flow) are needed to equal the existing circulating supply (stock) of an asset. Think of it as a compass pointing toward true monetary north. The higher the ratio, the scarcer the asset, and the better it stores value across time.
The power of stock-to-flow lies in a fundamental economic principle: when new supply is limited relative to existing stock, value tends to be preserved or increase. This is why assets like gold and real estate have historically served as stores of value – their stock-to-flow ratios provide natural inflation resistance. Gold emerged as the dominant form of money throughout human civilization partly because of its naturally high stock-to-flow ratio. With thousands of years of accumulated gold reserves and relatively small annual mining output, gold maintained its purchasing power across centuries, enabling trade, commerce, and wealth preservation across generations.
High stock-to-flow ratios create three critical advantages:
1. Supply stability: the total amount in circulation doesn’t change dramatically year to year.
2. Minimal dilution: new supply has minimal impact on total availability, protecting existing holders from having their wealth watered down.
3. Predictable confidence: thanks to supply stability and minimal dilution, holders can plan and save for the long-term.
Fiat Currency: the Scarcity Mirage
Assets with low stock-to-flow, such as the US dollar, provide the opposite: supply instability, dilution of purchasing power, and lack of predictability. With a centrally planned, declining stock-to-flow ratio, the dollar is a terrible store of value. Recent history illustrates this perfectly. In 2020-2021, the Federal Reserve increased the money supply by 40%, causing the dollar’s stock-to-flow ratio to plummet. The result was the highest U.S. inflation in four decades.
There are limited real resources in any economy for each unit of money to claim. The more dollars in existence, the fewer resources each dollar can claim. In other words, inflation.
Bitcoin: Perfect Digital Scarcity
Antithetical to fiat money, Bitcoin is absolutely scarce. Only 21 million will ever exist, and the new supply of Bitcoin hitting the market is predictably halved every four years. As the new supply issuance of Bitcoin decreases relative to the amount of Bitcoin in circulation, Bitcoin’s stock-to-flow ratio actually increases. From this vantage point, Bitcoin is better money than gold, whose stock-to-flow is relatively constant. Currently at 120, Bitcoin’s stock-to-flow is already twice that of gold.
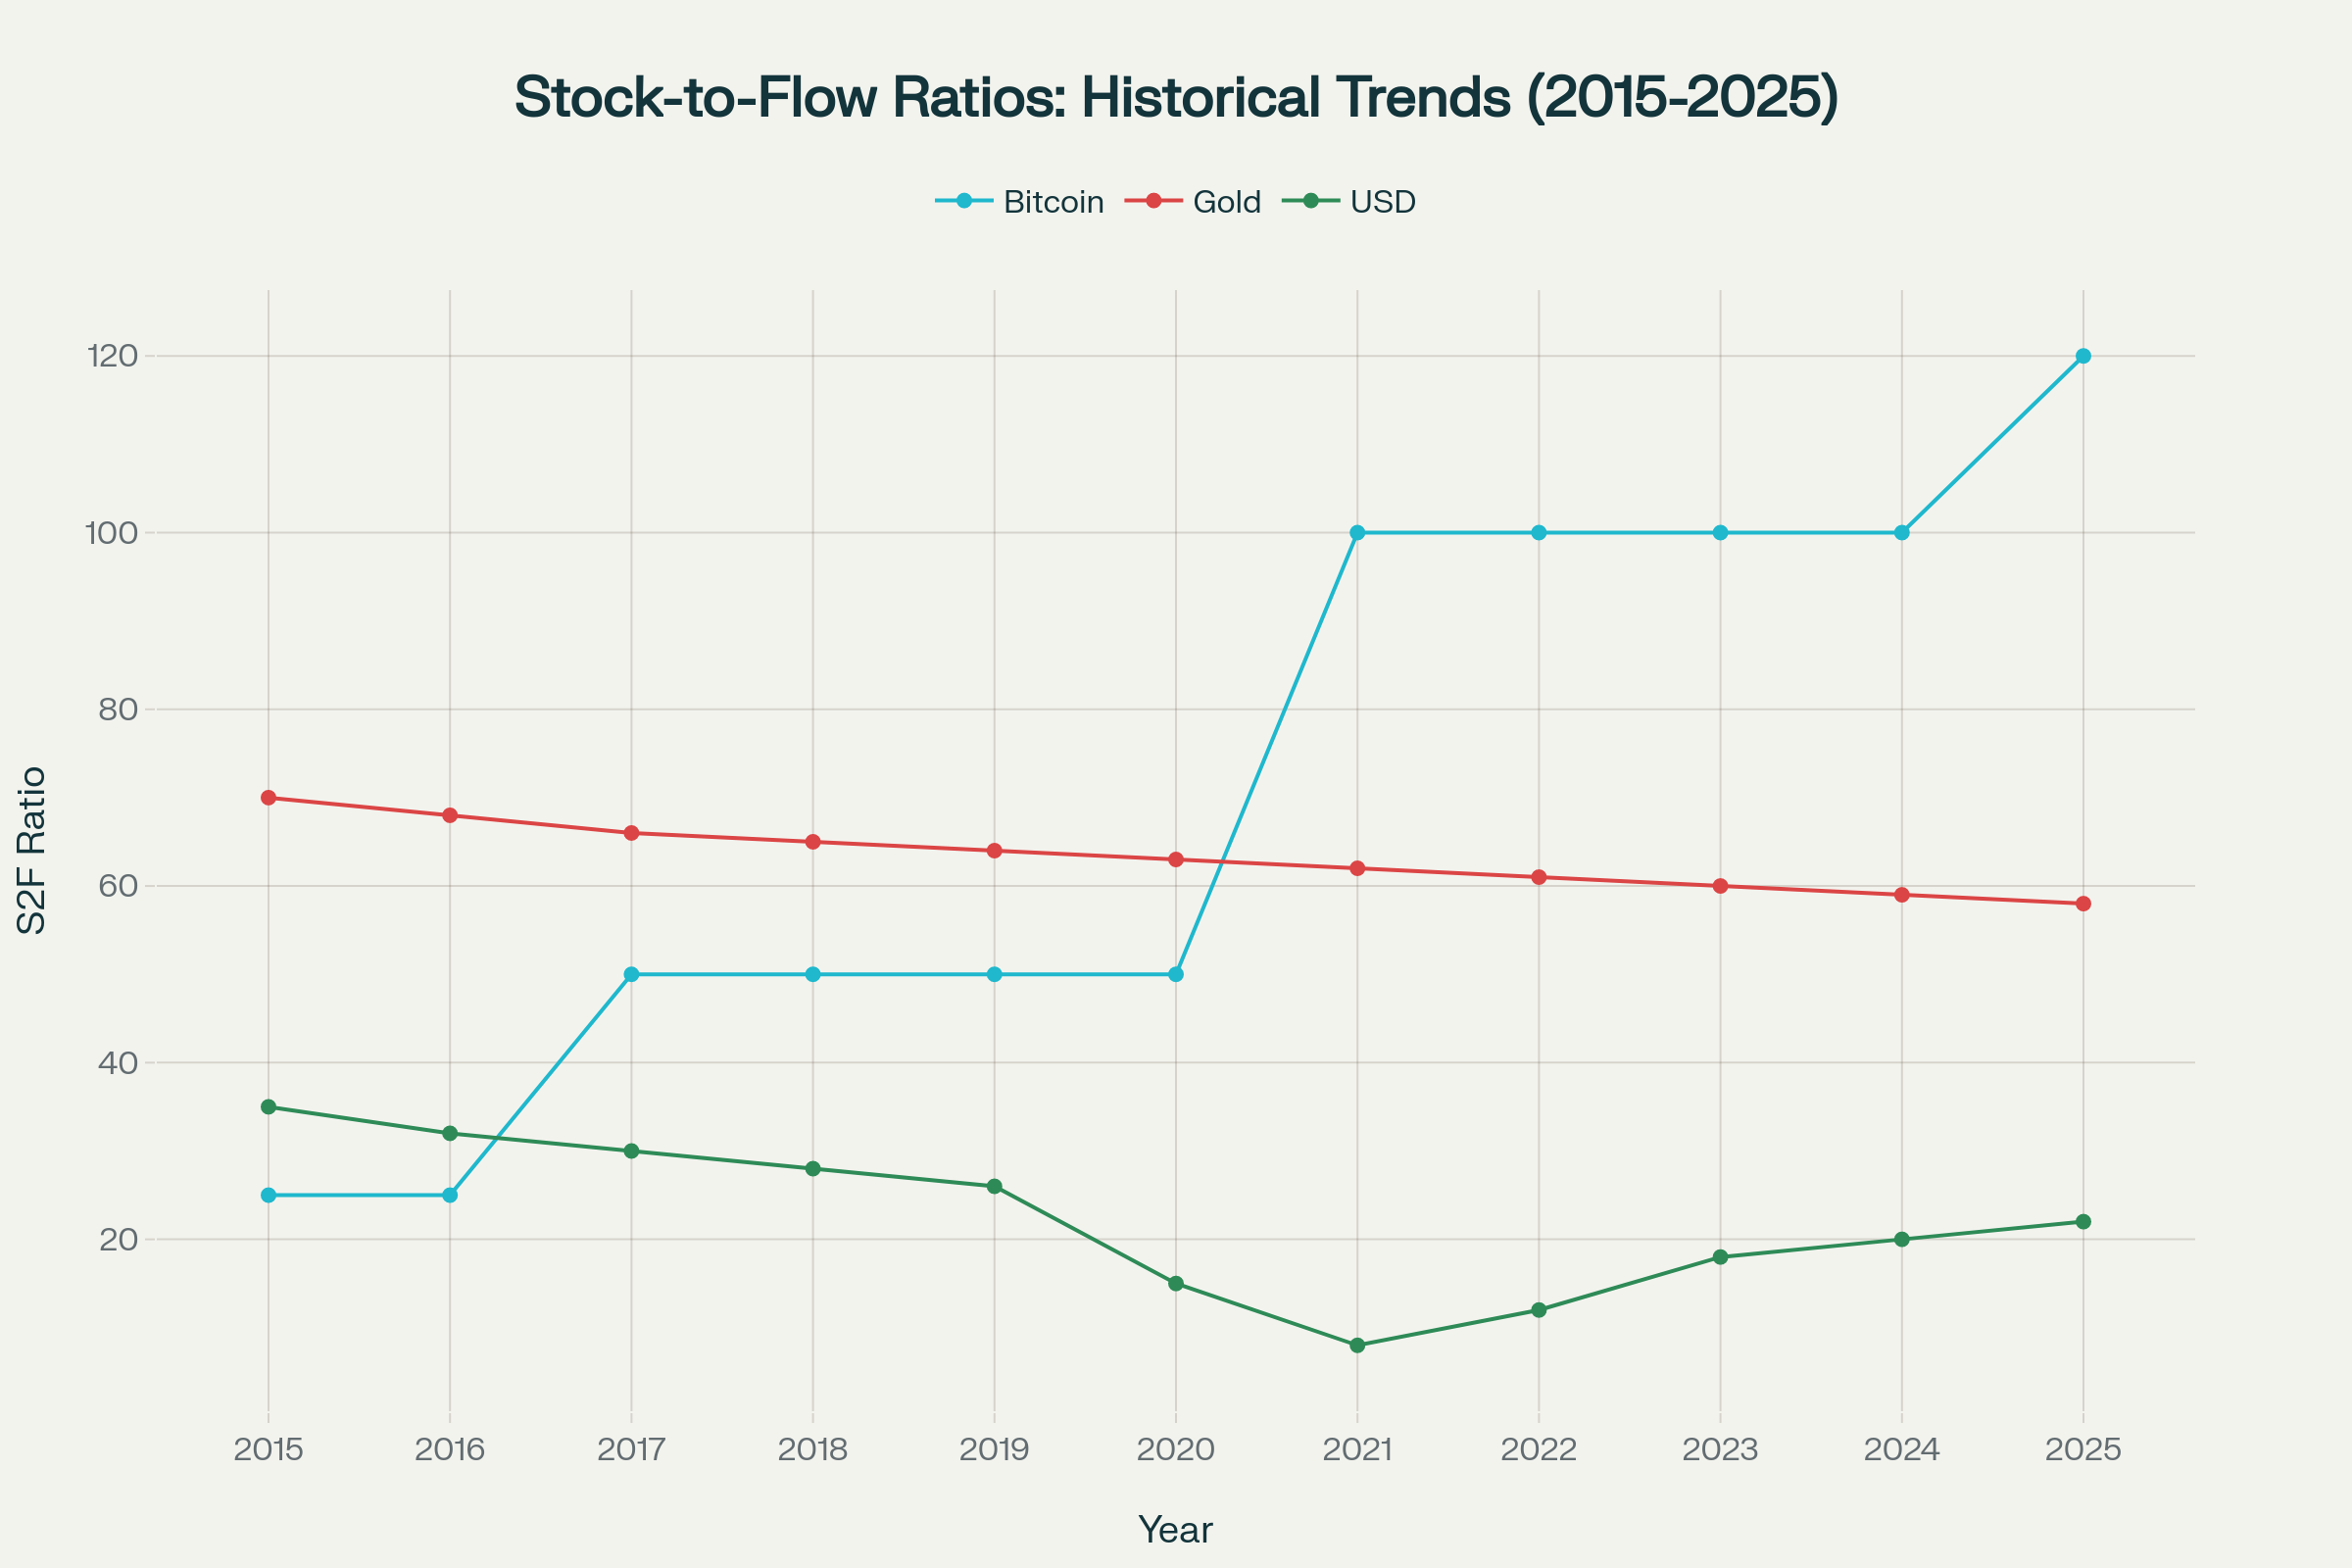
Historical Stock-to-Flow Ratios (2015-2025): Bitcoin's programmed scarcity creates an accelerating advantage over gold's natural scarcity and the dollar's declining monetary properties.
As Bitcoin’s stock-to-flow ratio increases, it attracts more users seeking scarce stores of value. This decreases remaining supply of Bitcoin and enforces scarcity, which attracts even more adoption. It’s a recursive flywheel of scarcity driving adoption, which drives more scarcity and adoption.
The Choice Ahead
Stock-to-flow analysis helps explain the monetary shifts we’re seeing today. It explains why Bitcoin is gaining value and adoption, why gold remains valuable, and why fiat currencies consistently lose value. Individuals, institutions, and nations are faced with a choice: embrace the asset with the highest, increasing stock-to-flow ratio, or watch wealth dissolve into the relentless tide of monetary expansion. History has already shown us which path leads to prosperity, and which leads to ruin.
This publication is for informational and educational purposes only — not investment, legal, tax, or accounting advice. Nothing herein constitutes a solicitation, recommendation, or offer to buy or sell any security or strategy. The author may hold — and may buy or sell without notice — securities, derivatives, or other instruments referenced. All opinions are the author’s, expressed in good faith as of publication, and subject to change without notice. Information is believed accurate but provided “as is,” without representations or warranties; errors or omissions may occur. Any forward-looking statements involve risks and uncertainties that may cause actual results to differ materially. Past performance is not indicative of future results. Do your own research and consult a qualified, licensed adviser who understands your circumstances before acting on this content. To the fullest extent permitted by law, the author and publication disclaim liability for any loss arising from reliance on this material.